Participation rates in sport among children and youth, aged 5 to 17 years, have increased considerably in 2022 compared to the record low of 44% in 2021 during the pandemic.
According to the Canadian Fitness and Lifestyle Research Institute’s 2022 Parent Survey of Physical Activity and Sport Participation among 5 to 17 year olds, 68% of Canadian children and youth have participated in sport in the year preceding the survey. This represents a substantial increase from the 44% who had participated in sport during the height of the pandemic in 2021. For this summary, sport reflects physical activities that involve competition, rules, and developing specific skills. Given this percentage is relatively high in 2022, understanding “participation” involves consideration of the regularity of participation (months per year) and the frequency of participation (times per week) in order to distinguish regular participators and those who do not participate very often.
More than half of the children and youth, who participated in sport, did so for at least half of the year.
Almost one quarter (24%) of children and youth who participated in sport did so every month of the year, whereas an additional 33% participated between six and eleven months of the year. A further 26% participated in sport for less than six months out of the year. A considerable percentage of parents (17%) were unsure how regularly their child participated throughout the year.
Figure 1. Regularity of sport participation (number of months/year) among children and youth
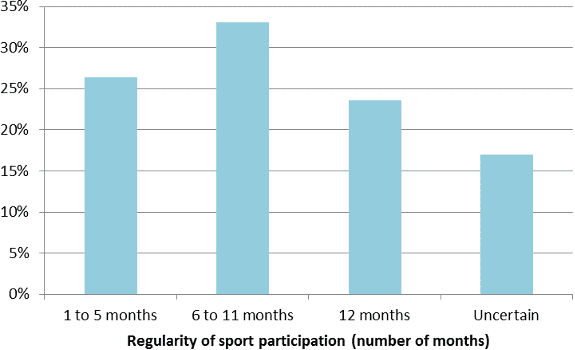
Source: 2022 Parent Survey of the Physical Activity and Sport Participation among 5 to 17 year olds, CFLRI
Parents were also asked how frequently their child participated in sport on a weekly basis during the months that they participated. Almost a quarter (23%) reported that their child participated very regularly at four or more times a week, and an additional 38% reported two to three times a week. Seventeen percent of parents reported that their child participated once a week. Very few (5%) of adults indicated that their child participated less often or variably depending on the month or the season.
Similar to regularity, 17% of parents were unsure how frequently their child participated in sport.
Figure 2. Frequency of sport participation (number of times/week) among children and youth
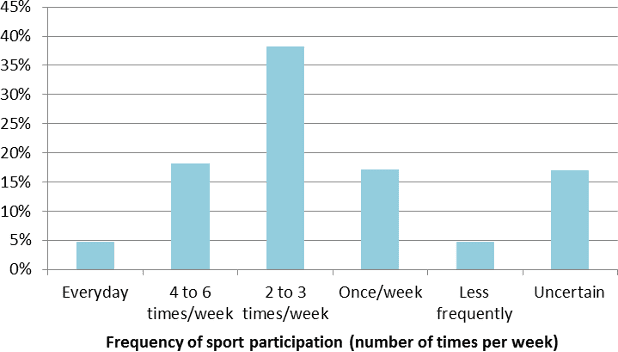
Source: 2022 Parent Survey of the Physical Activity and Sport Participation among 5 to 17 year olds, CFLRI
A higher percentage of boys than girls, aged 5 to 17 years, participated in sport.
Interestingly, there were no significant differences in sport participation between children (5 to 11 year olds, 68%) and youth (12 to 17 year olds, 67%). There were, however, differences by gender; a higher percentage of boys (71%) reported participating in sport during the past year compared to girls (64%). When examining age and gender of child together, girls aged 12 to 17 years were less likely to have participated in sport during the year than young boys (aged 5 to 11 years), but other than this finding, there were no other significant statistical differences within age and gender categories.
Figure 3. Participation in sport among children and youth, by age and gender of child
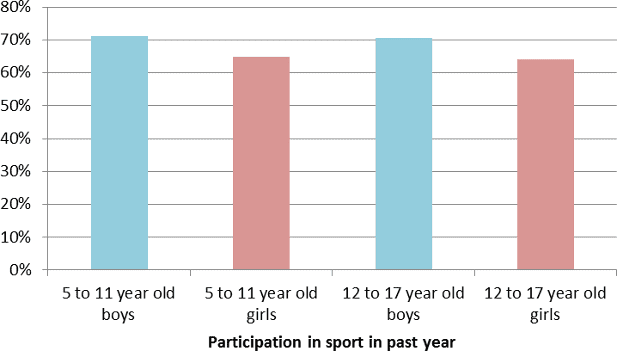
Source: 2022 Parent Survey of the Physical Activity and Sport Participation among 5 to 17 year olds, CFLRI
Interestingly, the number of months participating in sport does not vary significantly by age or gender of the child, yet frequency per week does vary by age. A greater percentage of youth (aged 12 to 17 years) reportedly participated in sport between four and six times a week compared to children (22% of youth compared to 14% of children), whereas a higher percentage of children (aged 5 to 11 years) participated once a week compared to youth (24% compare to 11%, respectively). When age of the child is explored by gender, youth are more likely than children to have participated in sport four to six times a week for both boys and girls, whereas a greater percentage of children (both girls and boys) reportedly participate in sport once a week.
Figure 4. Frequency of sport participation (number of times/week) among children and youth by age and gender
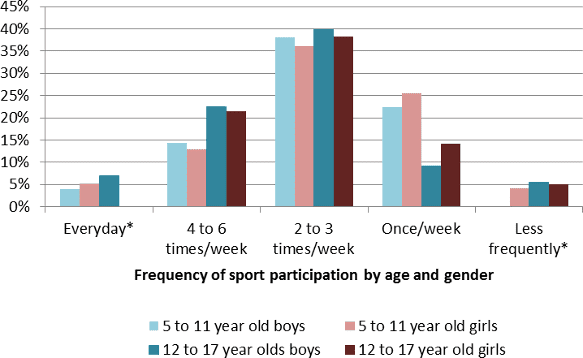
*Data suppressed due to cell size.
Source: 2022 Parent Survey of the Physical Activity and Sport Participation among 5 to 17 year olds, CFLRI
Sport participation varied by socio-economic status, particularly by measures of household income and parent’s education level.
Sport participation of children and youth increased with increasing household income, whereby 60% of children and youth living in lower income households (<$60,000 per year) reported participating in sport in the past year compared to 73% of those living in higher income households (≥$100,000 per year). A higher percentage of parents with a university education (72%) indicated that their child had participated in sport within the year compared to 64% of parents with a college education, and 61% of parents with a secondary school education. There were no differences in sport participation rates of children and youth by whether the parent had immigrated or not, and based on length of time that the parent had immigrated to the country.
Figure 5. Participation in sport of children and youth, aged 5 to 17 years, by household income
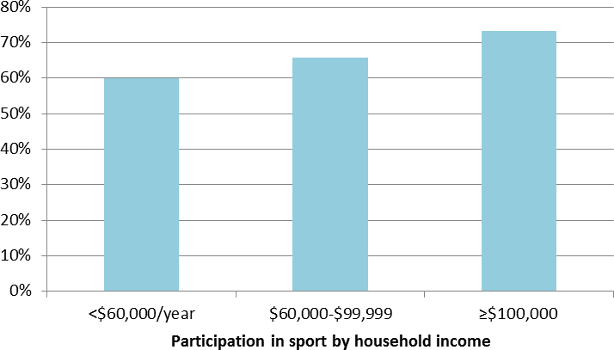
Source: 2022 Parent Survey of the Physical Activity and Sport Participation among 5 to 17 year olds, CFLRI
There were significant differences in the number of months participating by household income. A higher percentage of children and youth living in lower income households (<$60,000 per year) said that their child participated for one to five months per year compared to those living in the highest income households (≥$100,000 per year), whereas children living in the highest income households were most likely to have participated in sport all-year long.
Figure 6. Regularity of sport participation of children and youth by household income
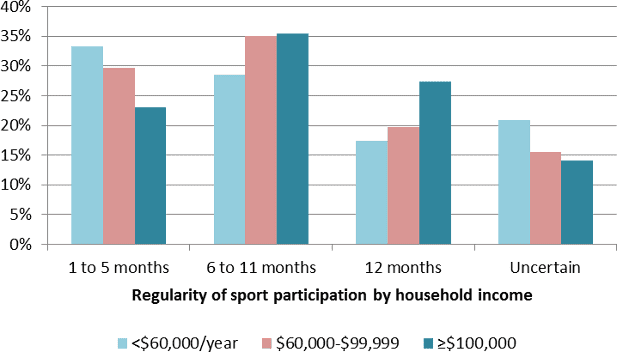
Source: 2022 Parent Survey of the Physical Activity and Sport Participation among 5 to 17 year olds, CFLRI
There were very few significant geographical differences in sport participation rates.
Although there were some very slight differences in sport participation by community size, this relationship was not statistically significant (73% of children and youth living in communities with less than 10,000 residents compared to 66% of those living in communities with ≥100,000 residents).
Compared to the Canadian average (68%), a larger percentage of children and youth living in Quebec (79%) participated in sport in the previous year, whereas fewer (56%) parents living in Manitoba reported this.
Parents living in Quebec were least likely to report that their child participated for one to five months per year, and were more likely to report participating all-year long, compared to the national average.
Figure 7. Participation in sport by children and youth, aged 5 to 17 years, by region
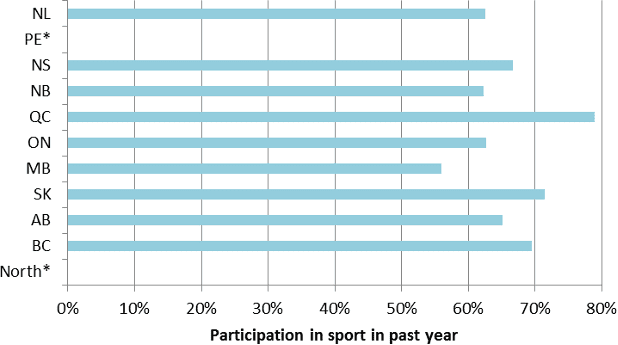
*Data suppressed due to cell size.
Source: 2022 Parent Survey of the Physical Activity and Sport Participation among 5 to 17 year olds, CFLRI
The Nature of sport participation
Soccer ranked as the number one sport among 5 to 17 year old sport participants in Canada.
In the survey, parents were also provided the opportunity to describe the types of sport that their children participated in most frequently. Among the top fifteen sporting activities that were identified for 5 to 17 year olds, soccer ranked highest at 28% of sport participants, followed by basketball (17%), hockey or ringette (16%), and aquatic-based activities such as swimming, diving, or water polo. Under 10% reported other activities such as softball or baseball (9% and includes other forms such as T-Ball), running, jogging, hiking (8%), volleyball (7%), bicycle-related activities (7% and includes bicycling, spinning, mountain biking, as examples), martial arts (6%), dance (6%), badminton (6%), gymnastics (5%), racquet sports (5% and includes tennis, squash, racquetball, as examples), football or rugby (5%), and ice skating (4% and includes figure and artistic skating, speed skating, as examples).
Table 1: Top 15 identified sports among children and youth, aged 5 to 17 years
| Rank | Activity | Percent |
| 1 | Soccer | 28% |
| 2 | Basketball | 17% |
| 3 | Hockey, ringette | 16% |
| 4 | Aquatic-based activities (e.g., swimming, diving) | 16% |
| 5 | Softball, baseball | 9% |
| 6 | Running, jogging, hiking | 8% |
| 7 | Volleyball | 7% |
| 8 | Bicycle-related activities | 7% |
| 9 | Martial arts | 6% |
| 10 | Dance | 6% |
| 11 | Badminton | 6% |
| 12 | Gymnastics | 5% |
| 13 | Racquet sports (e.g., tennis, squash) | 5% |
| 14 | Football, rugby | 5% |
| 15 | Ice skating (e.g., figure, artistic, speed) | 4% |
Source: CFLRI, aggregated results from the 2019-2021 Physical Activity Monitor
Most children and youth participated in their sport in a structured environment.
Most parents (61%) indicated that when their child participated in sport, they did so primarily in a structured environment, whereas 14% reported an unstructured environment primarily, and 25% reported both types of environments. These percentages did not differ significantly by age group, gender, or community size. A significant relationship, however, did exist between participation in the level of structure of the environment and household income; specifically, a lower percentage of children and youth living in the lowest income households (51% of those living in households with <$60,000 per year) reported participating in primarily a structured environment compared to 64% of those living in the highest income households (≥$100,000 per year). Compared to the national average, a greater percentage of parents living in Saskatchewan and Alberta indicated that their child primarily participated in a structured environment. On the other hand, fewer parents living in Quebec stated that their child participated in primarily a structured environment, and yet relatively more parents in this province said that their child primarily participated in an unstructured environments compared to the Canadian average.
Figure 8. Level of structure of sport participation by household income
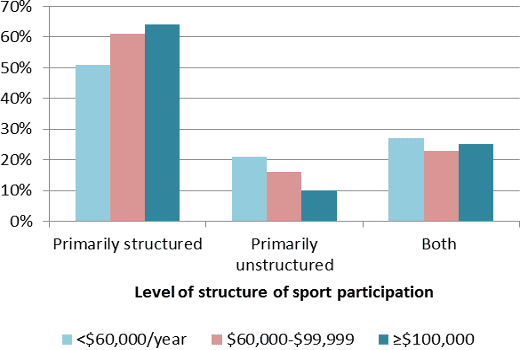
Source: 2022 Parent Survey of the Physical Activity and Sport Participation among 5 to 17 year olds, CFLRI
In addition, parents were also asked whether their child participated in sport primarily for competition or recreation. Most children and youth (70%) participated primarily in a recreational environment, whereas 30% reported participation in a primarily competitive environment. Although there were no significant differences in sport participation in these type of environments by the gender of the child, there are considerable differences by child’s age. For example, 80% of younger children (aged 5 to 11 years) participated in a primarily recreational environment compared to 62% of youth, aged 12 to 17 years. Conversely, almost twice as many youth participated in primarily a competitive environment (38%) compared to younger children, aged 5 to 11 years (20%). These age-related differences appeared for both boys and girls.
Figure 9. Level of competition of sport participation by age and gender of child
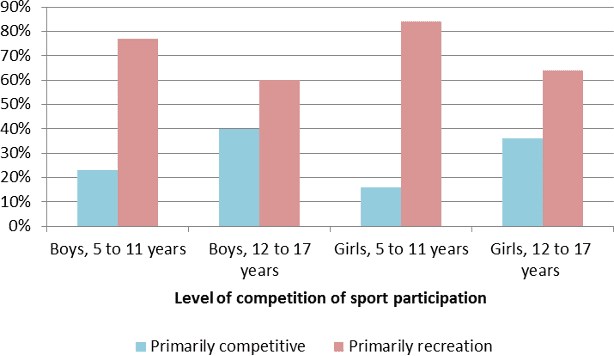
Source: 2022 Parent Survey of the Physical Activity and Sport Participation among 5 to 17 year olds, CFLRI
Sport participation in a primarily competitive environment varied by household income. Almost one in five (19%) of children and youth living in lower income households (incomes of <$60,000 per year) participated in sport in primarily a competitive environment compared to 34% of those living in higher income households (incomes of ≥$100,000 per year). On the other hand, 81% of children and youth living in the lowest income households participated in primarily a recreational environment, compared to 66% of those living in the highest income households. There were no significant differences in the level of competition by community size. Among children and youth living in Quebec, a higher percentage participated in a recreational environment (79%) and fewer in a competitive environment (21%) compared to the national average (70% and 30%, respectively).
Figure 10. Level of competition of sport participation of children and youth, aged 5 to 17 years, by household income
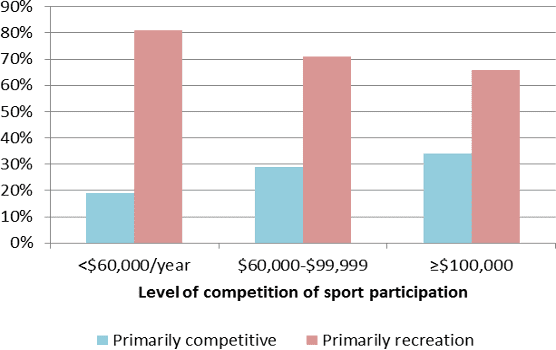
Source: 2022 Parent Survey of the Physical Activity and Sport Participation among 5 to 17 year olds, CFLRI
Most children who participated in sport made use of supports, like using a coach or training.
The survey also asked about the use of a coach for sport and whether or not the child trains to participate. Most parents (78%) reported their child’s use of a coach for sport. Although there were no differences in the use of a coach by the age of the child, there were slight differences by gender; a greater percentage of boys (80%) used the services of a coach compared to girls (75%). The reported use of a coach, however, increased considerably with household income; 69% of children and youth living in lower income households (<$60,000 per year) used a coach for sport compared to 82% of those living in higher income households (≥$100,000 per year). A greater percentage of parents with a post-secondary education reported that their child used a coach for sport compared to parents with a secondary school education. Although there were no differences in the use of coach by community size, there are some provincial differences; more specifically, compared to the national average, relatively fewer children and youth living in Quebec reported using a coach, whereas relatively more living in Alberta reported this.
Figure 11. Use of a coach in sport by children and youth, aged 5 to 17 years, by parental education level
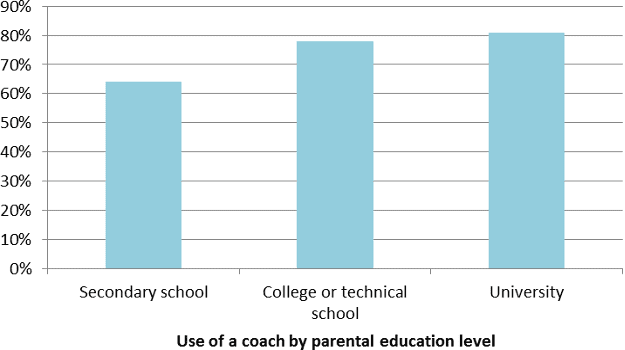
Source: 2022 Parent Survey of the Physical Activity and Sport Participation among 5 to 17 year olds, CFLRI
In terms of training for sport, 67% of children and youth aged 5 to 17 reportedly did so. Despite no gender differences, a higher percentage of youth (72%, aged 12 to 17) trained compared to younger peers (61%, 5 to 12 year olds). Similar to coaching, the percentage of children and youth that trained for their sport increased with increasing household income; 61% of children and youth living in lower income households trained compared to 71% of those living in higher income households. Compared to the national average, relatively fewer children and youth living in Quebec trained for sport (60% in Quebec compared to 67% in Canada). There were, however, no significant differences with community size.
Figure 12. Use of training in sport by children and youth, aged 5 to 17 years, by household income
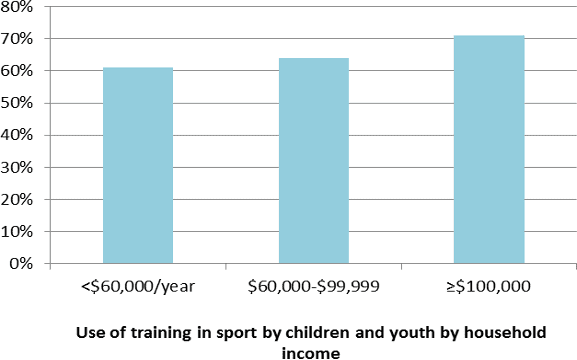
Source: 2022 Parent Survey of the Physical Activity and Sport Participation among 5 to 17 year olds, CFLRI
Many children and youth who participated in sport did so through community programming, however, it depended on some important factors.
Some of the lack of significant differences in participation, and in some cases the appearance of differences may be possibly explained, to some extent, on where children and youth were having most access to sport opportunities. This survey, therefore, asked parents where their child participated most in sport – in school-based or community-based programming. Almost half of parents (48%) indicated that their child participated in sport through community-based programming most frequently, whereas 21% reported school-based programming, and a further 23% reported both venues equally. A sizable percentage of parents (8%) were uncertain where their child participated in sport most often. Although there were no significant gender-based differences, location of sport did vary considerably with the age of the child. For school-based programming, 28% of youth aged 12 to 17 reportedly participated in sport at this venue compared to 12% of 5 to 11 year olds. Conversely, 62% of 5 to 11 year olds participated in sport in community-based programming compared to 36% of 12 to 17 year old youth. These relationships with age hold for both girls and boys. Socio-economic factors were also associated with the most frequented location of sport. For example, 28% of children and youth living in lower income households (<$60,000 per year) participated in sport through school-based programming compared to 18% of those living in the highest income households (≥$100,000 per year). On the contrary, 36% of children and youth living in lower income households participated in sport in community-based programming versus 53% living within the highest income households. Despite no significant differences by community size, there was one significant difference by province; relatively fewer children and youth living in the Quebec reported participating in sport most frequently through community-based programming compared to Canada’s average.
Figure 13. Location of sport participation by children and youth, by age and gender of child
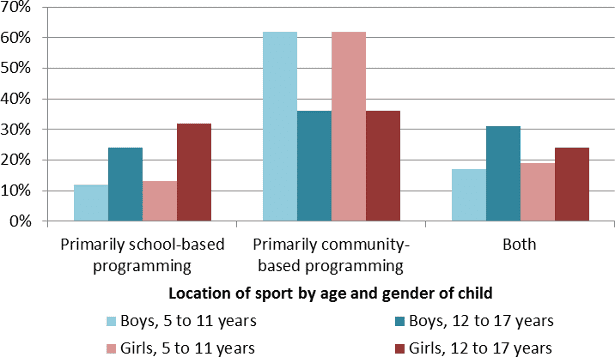
Source: 2022 Parent Survey of the Physical Activity and Sport Participation among 5 to 17 year olds, CFLRI
Many parents stated that they expect their child to participate in sport within the next six months, but it varied by important factors like age, gender, and socio-economic status.
Parents were also asked about their perceptions about the likelihood of their child participating in sport in the six months following the survey. Over half (55%) of parents reported that it was very likely that their child would participate in sport in the next six months, and an additional 25% indicated that it was somewhat likely. Less than one in five parents (15%) said that it was not very likely that their child would participate in sport in the next six months, whereas 5% of parents were uncertain. According to parents, a slightly larger percentage of younger children (58% of children aged 5 to 11 years) would very likely participate in sport in the next six months compared to 51% of youth (aged 12 to 17 years). Conversely, a higher percentage of youth (20%) were not very likely to participate in sport within six months, compared to 10% of children aged 5 to 11 years. A greater percentage of boys (58%) compared to girls (51%) reportedly were very likely to participate in sport in the next six months, whereas a higher percentage of girls were not very likely to participate compared to boys (18% versus 12%, respectively). When looking at age and gender combined, girls, aged 12 to 17, were least likely to participate in sport in the next six months; that is, a higher percentage of parents of 12 to 17 girls stated that it was not very likely that they would participate in sport in the next six months compared to parents of younger girls and parents of all ages of boys.
Figure 14. Likelihood of future participation in sport by children and youth, by age and gender of child
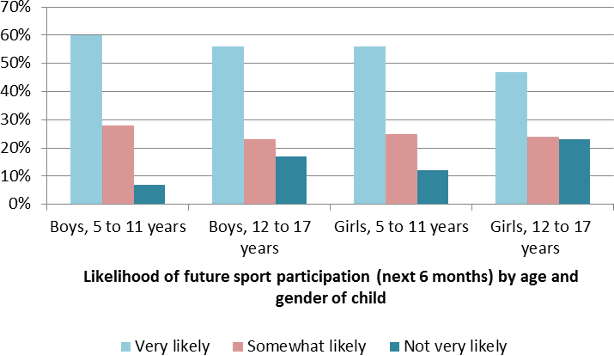
Source: 2022 Parent Survey of the Physical Activity and Sport Participation among 5 to 17 year olds, CFLRI
The likelihood of participating in sport within the subsequent six months varied by socio-economic factors, and more specifically, household income. According to parents, the percentage of children and youth who were very likely to participate in sport in the next six months increased with household income from 46% of parents living in the lowest income households (<$60,000 per year) compared to 62% from the highest income households (≥$100,000 per year). In terms of geographical considerations, a lower percentage of parents living in Manitoba indicated that there child would very likely participate in sport in the following six months, compared to the average, whereas a higher percentage of children and youth living in Quebec reported this. A higher percentage of children and youth living in New Brunswick were not very likely to participate in sport compared to the national average.
Figure 15. Likelihood of future participation in sport by children and youth by household income
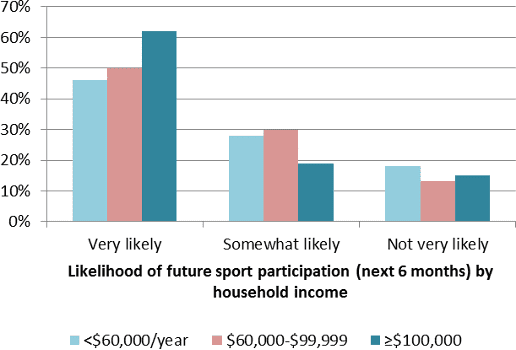
Source: 2022 Parent Survey of the Physical Activity and Sport Participation among 5 to 17 year olds, CFLRI
Production of this summary has been made possible through a financial contribution from the Government of Canada. The views expressed herein do not necessarily represent their views.