Participation rates in sport among adults, aged 18 years and older, have remained relatively stable over time.
According to the 2024 Physical Activity and Sport Survey, by Leger in collaboration with the Canadian Fitness and Lifestyle Research Institute (CFLRI), 27% of adults have participated in sport in the year preceding the survey. Sport reflects physical activities that involve competition, rules, and developing specific skills. In addition to participation rates, “participation” should reflect an understanding of the regularity of participation (months per year) and the frequency of participation (times per week) in order to distinguish regular participators and those who do not participate very often.
Roughly six out of ten adults, who participated in sport, did so for at least half of the year.
Almost two out of ten adults (19%) who participated in sport did so every month of the year, whereas an additional 42% participated between six and eleven months. Roughly four in ten (39%) participated in sport for less than six months out of the year.
Figure 1: Regularity of sport participation (number of months per year)
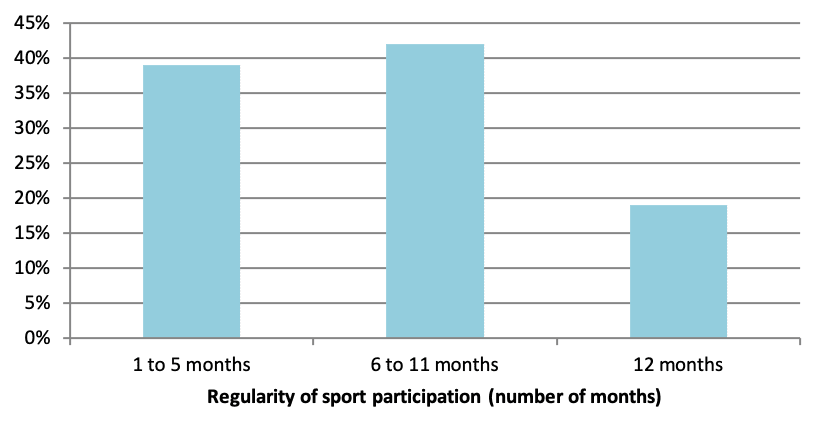
Source: 2024 Physical Activity and Sport Survey, Leger with CFLRI
Sport participants were also asked how frequently they participated in sport on a weekly basis during the months that they participated. Almost two out of ten adults (18%) reported that they participated very regularly at four or more times a week, and 34% reported two to three times a week. Just over one-quarter of adults (28%) reported that they participated once a week. Two out of ten (20%) adults indicated that they participated less often or variably depending on the month or the season.
Figure 2: Frequency of sport participation (number of times per week)
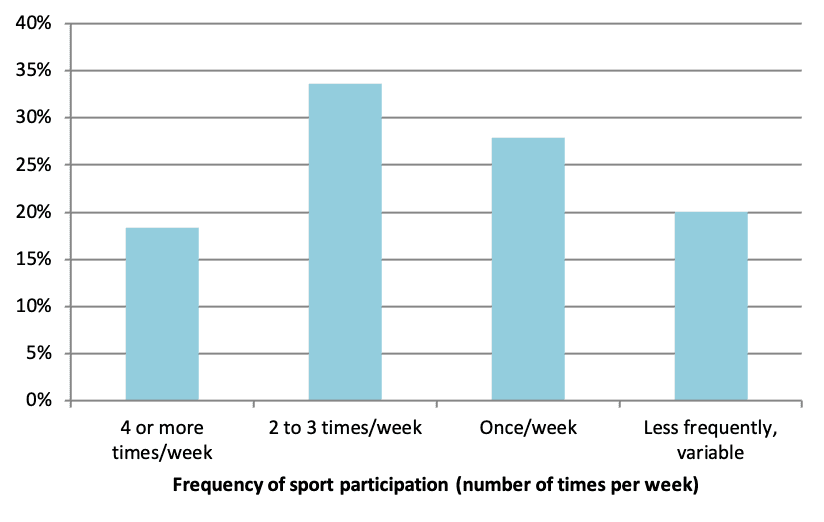
Source: 2024 Physical Activity and Sport Survey, Leger with CFLRI
More men than women participated in sport and participation declines substantially with age.
Overall, considerably more men (36%) than women (19%) participated in sport in the previous twelve months. In addition, there were considerable declines in sport participation with increasing age; for example, 53% of 18 to 24 year olds participated in sport compared to 13% of adults aged 65 years and older. When combining age and gender together, the gender gap appeared among all age groups and the decline in participation rates with age appeared for both men and women.
Figure 3: Participation in sport by age and gender
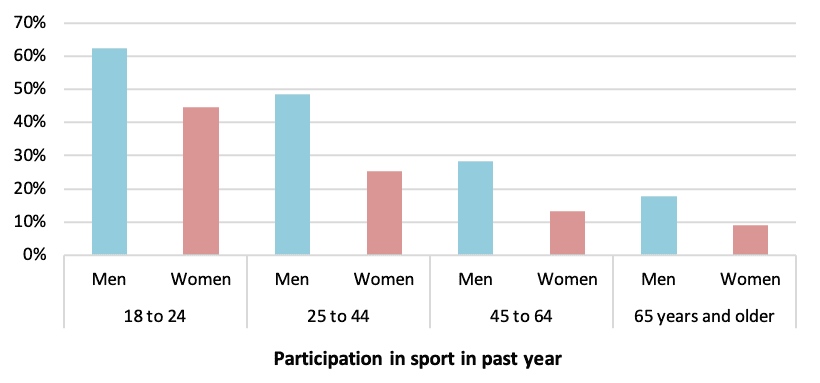
Source: 2024 Physical Activity and Sport Survey, Leger with CFLRI
In terms of the number of months participating in sport, a greater percentage of men overall (21%) reported participation during each month of the year compared to women (16%), whereas relatively more women (43%) said that they participated for less than six months out of the year compared to 37% of men. Interestingly, however, there were no significant gender differences with respect to the frequency of participation per week. There were very few significant differences regarding the regularity of participation (number of months) by overall age groups, with one exception; relatively fewer older adults (65 years and older) indicated that they participated in sport for fewer than six months out of the year compared to younger age groups. In terms of frequency of participation per week, a greater percentage of young adults (aged 18 to 24 years) reported participating in sport at least four times per week compared to adults aged 25 to 64 years; on the other hand, relatively more older adults (65 years and older) reported that they participated between two to three times a week compared to adults younger than 45 years.
Figure 4: Frequency of sport participation (numbers times per week) by age
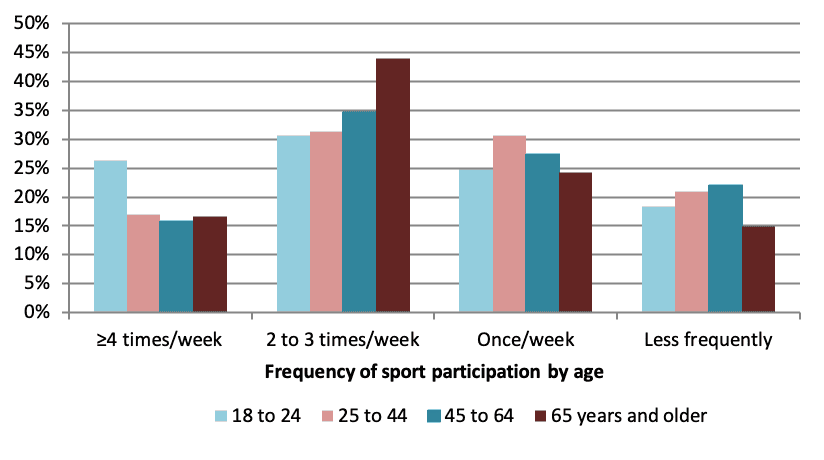
Source: 2024 Physical Activity and Sport Survey, Leger with CFLRI
When age is explored by gender, there were no significant gender differences by age group for both regularity and frequency of participation. For males, however, older men (65 years and older) were less likely than men aged 25 to 44 years to have participated less than six months in the year. A similar relationship exists for women; however, older women were less likely than women aged 18 to 24 years to report participation for less than six months in the year. In terms of frequency of participation in sport per week, men aged 18 to 24 years were more likely than men aged 25 to 64 years to report participating four or more times per week. Older men (65 years and older) were more likely to have said that they participated two to three times per week, compared to men younger than 45 years. These differences, however, were not significant among women.
Sport participation varied by socio-economic status, particularly by household income and education.
Sport participation generally increased with increasing household income, whereby 19% of adults living in lower income households (<$40,000 per year) reported participating in sport in the past year compared to 35% of those living in higher income households (≥$100,000 per year). A greater percentage of adults with a university education (35%) indicated that they had participated in sport within the year compared to 24% of individuals with a college education, and 22% of adults with a secondary school education.
Figure 5: Participation in sport by household income
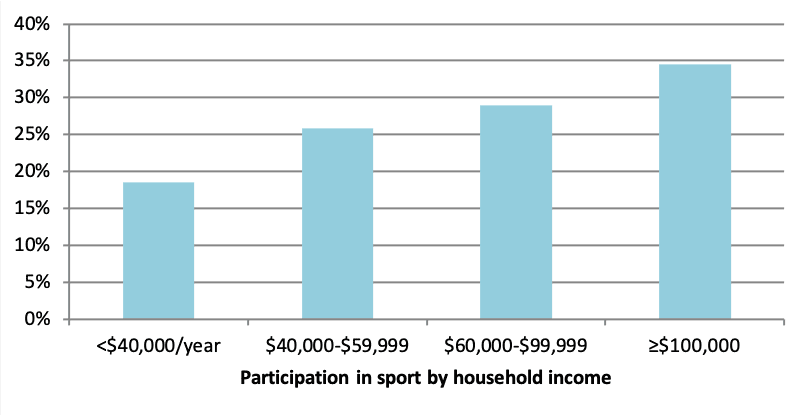
Source: 2024 Physical Activity and Sport Survey, Leger with CFLRI
There were some significant differences in the number of months participating by household income. A higher percentage of adults living in highest income households (≥$100,000 per year) said that they participated in sport all-year long, compared to those living in households with the lowest incomes. In terms of frequency (number of times per week), however, there are no significant differences by household income.
Figure 6: Regularity of sport participation by household income
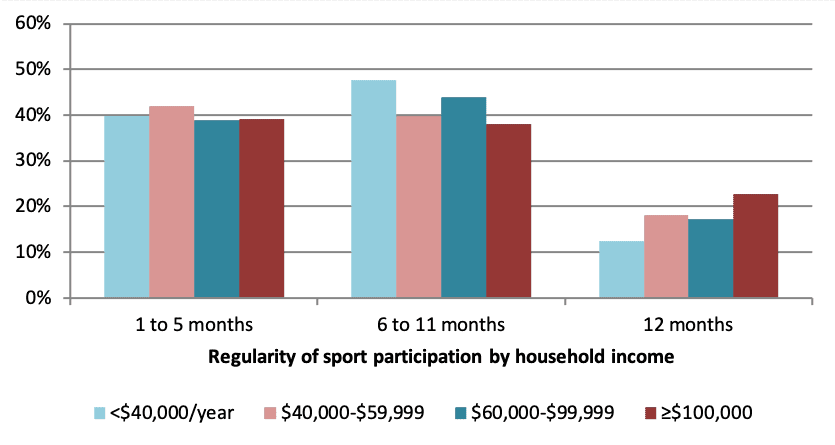
Source: 2024 Physical Activity and Sport Survey, Leger with CFLRI
Adults who were born in Canada (26%) reported lower sport participation rates than those who were born elsewhere (33%). Adults who have lived in the country the longest (over fifteen years) report lower participation rates than those who have lived in the country less than this time. A lower percentage of adults who were born in Canada participated for less than six months per year (37%) than those who were born elsewhere (45%), whereas the opposite relationship exists for those participating every month of the year (21% of those born in Canada compared to 12% of those who were born elsewhere). In addition, a slightly lower percentage of adults who were born in Canada reported participation less than once a week or on a variable basis (18%) compared to adults who were born elsewhere (26%).
Relatively fewer individuals living in the smallest communities or rurally participated in sport.
There were some very slight differences in sport participation by community size, whereby relatively fewer adults living in the smallest communities (less than 10,000 residents) participated in sport compared to those living in larger communities. Furthermore, individuals living in urban environments (29%) were slightly more likely than those living rurally (24%) to have participated in sport. Compared to the Canadian average (27%), a slightly higher percentage of individuals living in Quebec reported participating in sport, whereas those living in Nova Scotia were slightly less likely to participate.
Figure 7: Participation in sport by region
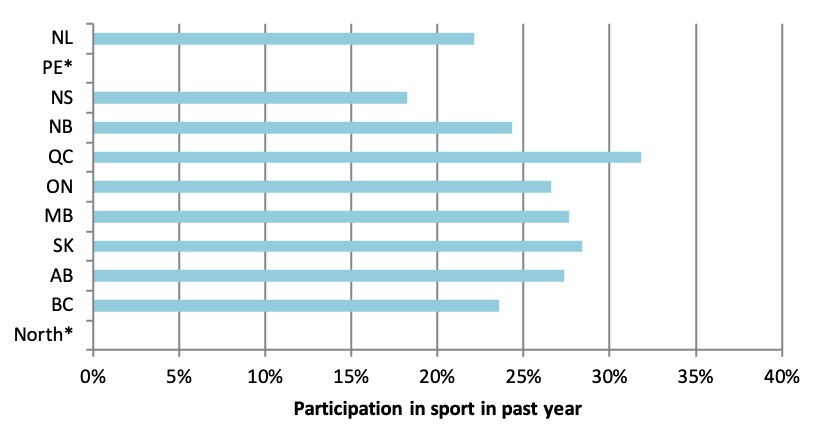
Source: 2024 Physical Activity and Sport Survey, Leger with CFLRI
* PE and the North not available due to sample size
Almost half of adults participated in a structured sport environment.
Almost half of adults (47%) indicated that when they participated in sport, they did so primarily in a structured environment, whereas 30% reported a primarily unstructured environment, and 22% reported both types of environments. A slightly higher percentage of men (33%) stated that they primarily participated in an unstructured sport environment compared to women (26%). Interestingly, older adults (65 years and older) were most likely to have said that they primarily participated in sport in a structured environment, yet were least likely to say that they have participated in primarily unstructured environments. These percentages did not differ significantly by household income, education level, disability status, province/territory, or community size.
Figure 8: Level of structure of sport participation by age
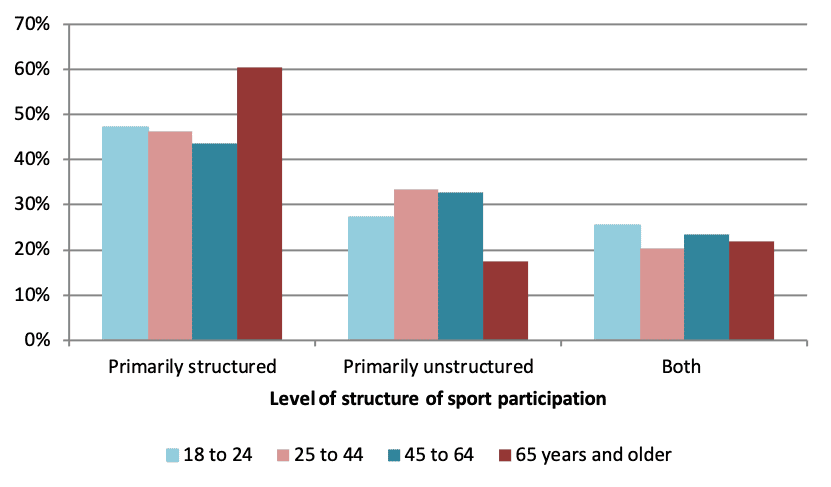
Source: 2024 Physical Activity and Sport Survey, Leger with CFLRI
Half of sport participants indicated that they competed in their sport. Relatively more men (57%) than women (39%) competed in sport; these gender-related differences appeared in all age groups. Slightly more individuals who have cited a disability (57%) competed in sport compared to those without a disability (49%). There were no overall significant differences in level of competition by age group, education level, household income level, community size, or community location.
Figure 9: Competing in sport by age and gender
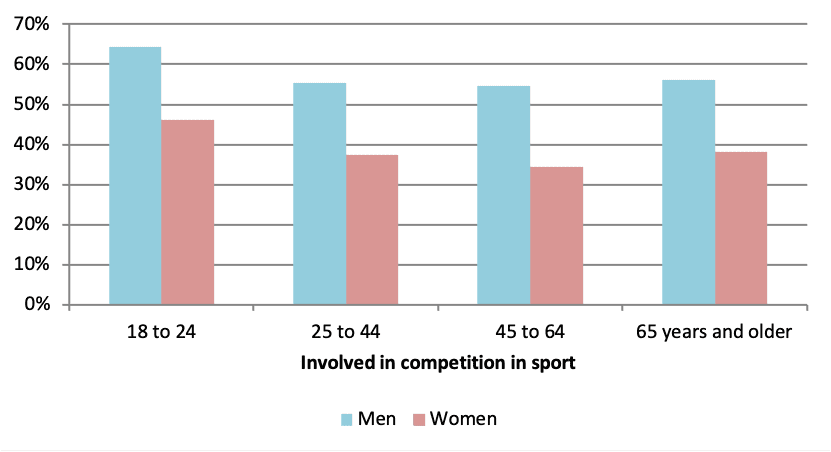
Source: 2024 Physical Activity and Sport Survey, Leger with CFLRI
Roughly half or less who participated in sport made use of supports, like using a coach or training.
The survey also asked about the use of a coach for sport and whether or not the individual trains. Almost one-third of adults (32%) reported the use of a coach for sport. There were no overall differences in the use of a coach by gender of the participant, and there is also a lack of gender-related differences at each age group. There was a general decrease in the use of a coach by increasing age of the participant (e.g., 51% of adults aged 18 to 24 years compared to 16% of adults 65 years and older). There were no significant differences in the reported use of a coach for sport by education or household income level. Relatively more individuals with disabilities (44%) stated the use of a coach compared to those without a disability (29%). There were no differences in the use of coach by community size, or by province/territory.
Figure 10: Use of a coach for sport by age
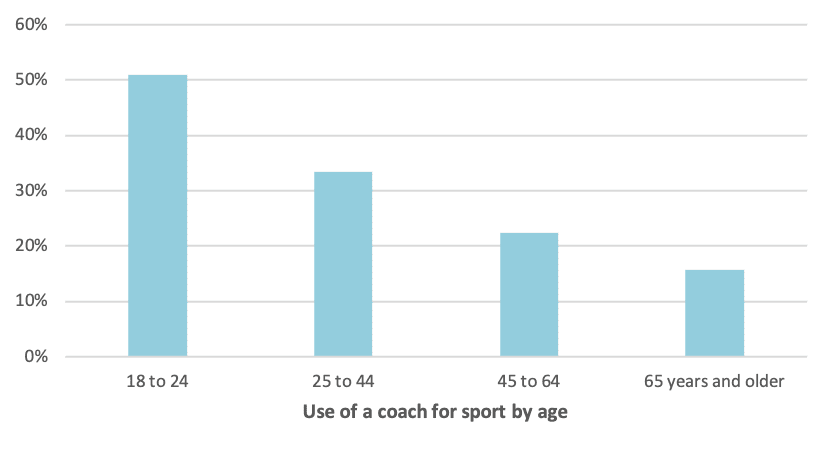
Source: 2024 Physical Activity and Sport Survey, Leger with CFLRI
Roughly half of adults (51%) said that they trained for their sport. A higher percentage of men (54%) stated that they trained for their sport compared to 44% of women; these gender-related differences were significant among adults aged 25 to 64 years. Generally speaking, there is a decline in the percentage of adults who trained with increasing age. A slightly higher percentage of individuals with disabilities (57%) mentioned that they trained for sport compared those individuals who did not cite disabilities (49%). There were, however, no significant differences with province/territory or community size, although individuals living in urban environments were generally the most likely to report having trained for a sport. Relatively fewer adults who were born in Canada (49%) trained for sport compared to those who were born elsewhere (59%).
Figure 11: Use of training in sport by community location
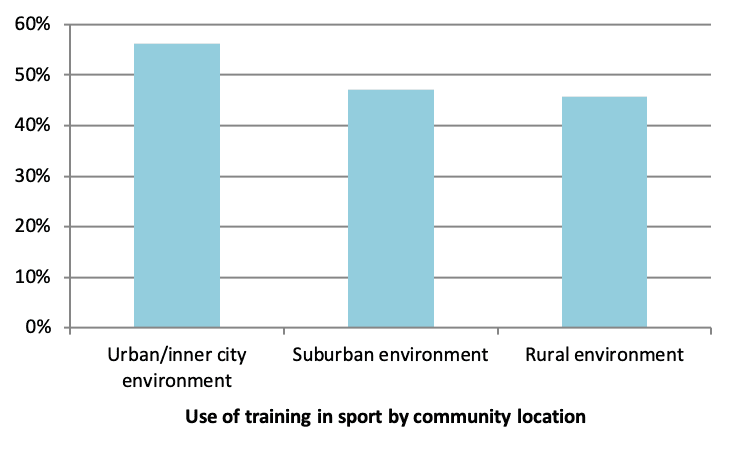
Source: 2024 Physical Activity and Sport Survey, Leger with CFLRI
Production of this summary has been made possible through a financial contribution from the Government of Canada. The views expressed herein do not necessarily represent their views.