
Volunteering rates in sport, physical activity and recreation in 2024 were generally lower than the pre-pandemic period.
According to the 2024 Physical Activity and Sport Survey by Leger in collaboration with the Canadian Fitness and Lifestyle Research Institute (CFLRI), 11% of adults have volunteered for activities related to sport, physical activity and recreation in the past twelve months. An additional 26% have not volunteered in the past year, but have volunteered for sport, physical activity and recreation in the past. Almost two-thirds of individuals (63%) have never volunteered. Based on a CFLRI survey in 2020, however, more than double the 2024 percentage (27%) indicated that they volunteered in the past year (CFLRI, 2020 Sport Monitor).
Figure 1: Volunteering rates for sport, physical activity, and recreation
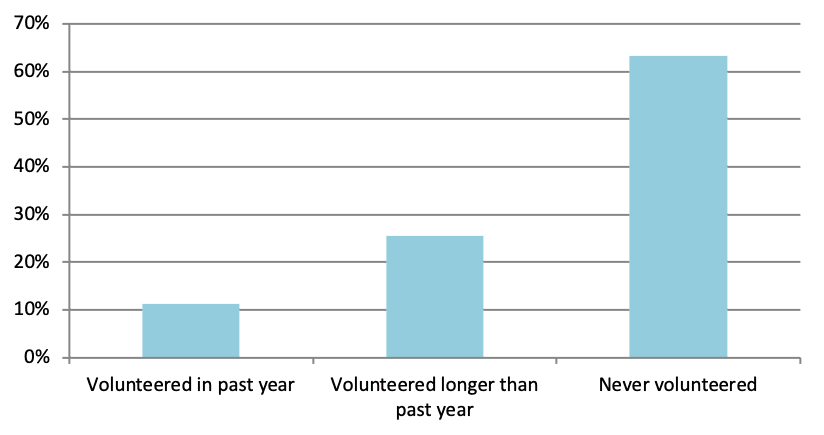
Source: 2024 Physical Activity and Sport Survey, Leger with CFLRI
Relatively more men (14%) than women (8%) volunteered in the past year, or have volunteered longer than twelve months ago; on the contrary, relatively more women than men indicated that they did not volunteer in the past in activities related to sport, physical activity, or recreation. Generally speaking, there was a decline in the percentage of those who have volunteered in the past year with increasing age of the volunteer (e.g., 22% among 18 to 24 year olds down to 7% of adults aged 65 and older). Conversely, the percentage of individuals who reported that they have never volunteered for sport, physical activity, and recreation increased with increasing age.
Figure 2: Volunteering in sport, physical activity, and recreation by age and gender
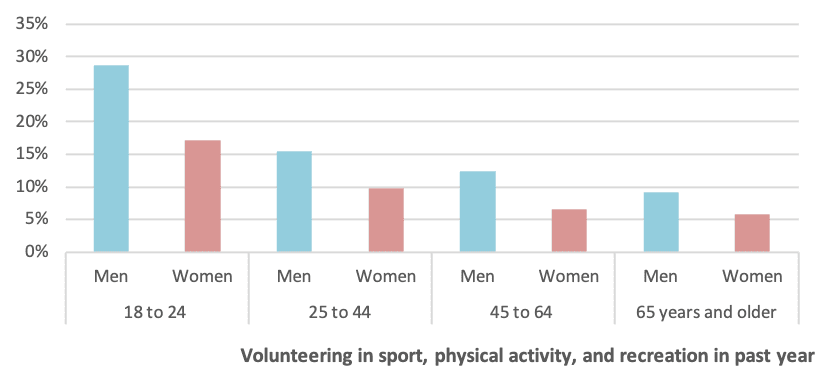
Source: 2024 Physical Activity and Sport Survey, Leger with CFLRI
A greater percentage of individuals with a university education indicated that they had volunteered within the past year or more than a year ago, compared to those with lower education; on the other hand, relatively fewer adults with a university education said that they have never volunteered. In a similar way, a higher percentage of adults living in the highest income households reported that they had volunteered in the past year, and they were least likely to have said that they have never volunteered.
Figure 3: Volunteering in sport, physical activity, and recreation by household income
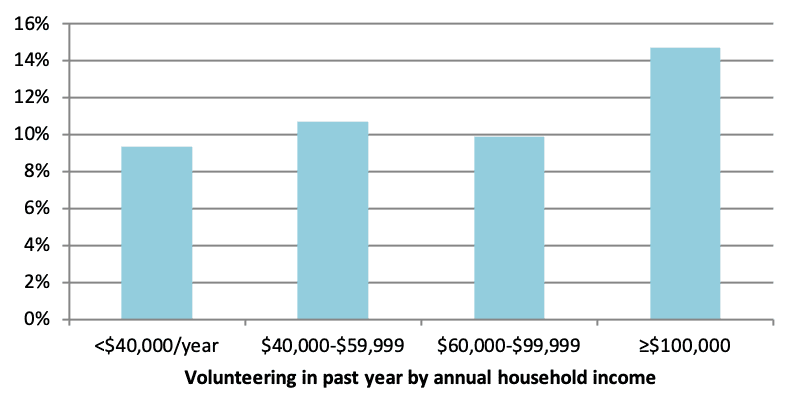
Source: 2024 Physical Activity and Sport Survey, Leger with CFLRI
Compared to those who did not participate in sport, a considerably greater percentage of individuals who participated in sport also reported volunteering in the past year or volunteered more than a year ago; the converse relationship also appeared whereas 71% of those who did not participate in sport also have never volunteered compared to 42% of individuals who participated in sport.
Figure 4: Volunteering in sport, physical activity, and recreation by sport participation
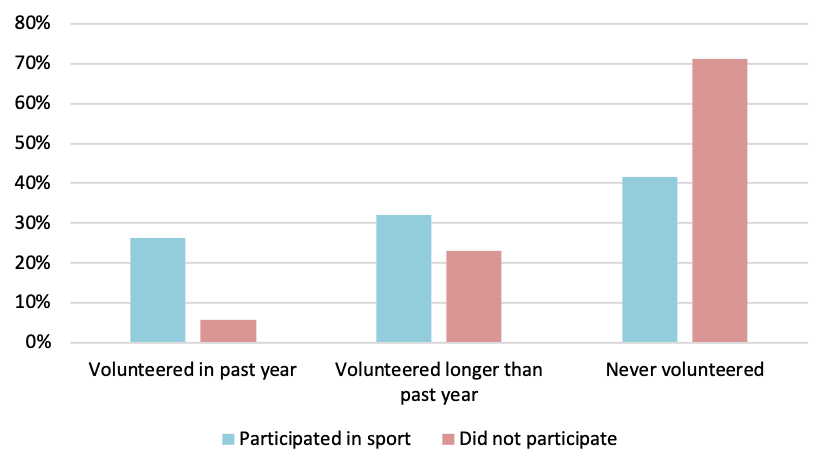
Source: 2024 Physical Activity and Sport Survey, Leger with CFLRI
Compared to the national average (11%), relatively more adults living in Saskatchewan (17%) indicated that they volunteered in the past year, whereas relatively fewer individuals living in Quebec reported volunteering (9%). On the contrary, a greater percentage of individuals living in Quebec stated that they have never volunteered for activities related to sport, physical activity, and recreation, whereas a lower percentage in Saskatchewan and Alberta said this.
About one-third of volunteers for sport, physical activity, and recreation volunteered as a coach.
Volunteers were also asked about the manner in which they volunteered in sport, physical activity, and recreation. Table 1 describes the overall findings.
Table 1: Manner in which adults volunteered in activities related to sport, physical activity, and recreation
| Role | Percentage |
| Coach, assistant coach | 32% |
| Fundraising | 20% |
| Administration duties | 16% |
| Referee or official | 16% |
| Manager, assistant manager | 13% |
| Registration duties | 11% |
| Member of board of directors | 11% |
| Some other capacity | 6% |
Source: 2024 Physical Activity and Sport Survey, Leger with CFLRI
A larger percentage of men volunteered in the role of coach, manager, or referee, whereas relatively more women volunteered in fundraising duties. Slightly fewer adults aged 65 years and older volunteered as a coach compared to individuals younger than 65 years. Individuals living in the highest income households were more likely than individuals living in the lowest income households to have reported volunteering as a coach. Sport participants were also most likely to have volunteered as a coach, referee or official, or for registration duties, whereas non-participants were most likely to volunteer in some other capacity not listed.
Figure 5: Manner in which adults volunteered by gender
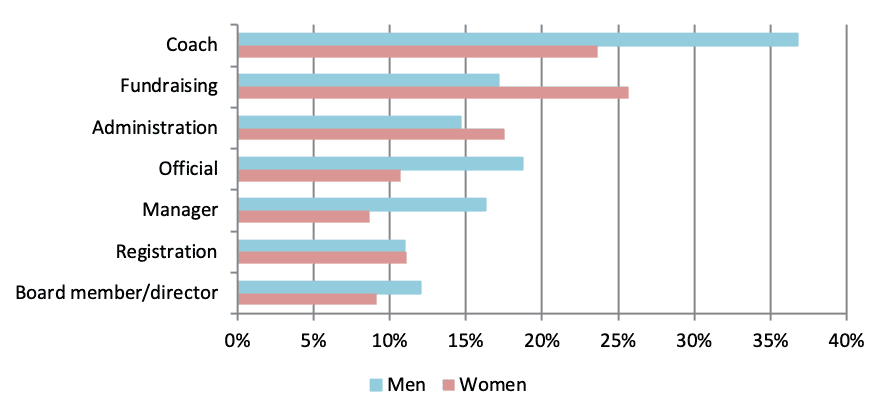
Source: 2024 Physical Activity and Sport Survey, Leger with CFLRI
The club or organization requesting assistance was the most frequented recruitment tactic.
The survey asked volunteers how they were recruited to participate as a volunteer. Table 2 summarizes the most reported ways that they were recruited to volunteer for sport, physical activity, and recreation.
Table 2: Most frequented manner to recruit individuals to volunteer
| Recruitment tactic | Percentage |
| Club or organization asked | 31% |
| Sought out volunteering activity | 23% |
| Friends or acquaintances asked | 22% |
| Family asked | 14% |
| Mandatory requirement of community service | 5% |
| Responded to advertisement in media | 4% |
Source: 2024 Physical Activity and Sport Survey, Leger with CFLRI
Older adults (65 years and older) were most likely to indicate that they sought out the volunteer activities themselves, compared to younger adults. There were no significant differences in recruitment method by gender, household income, education level, sport participation, or community-based factors.
Figure 6: Most frequented recruitment method for volunteers
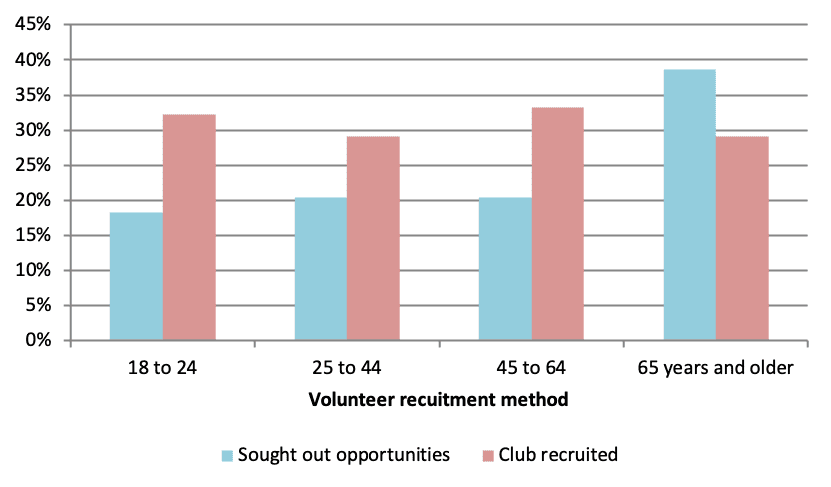
Source: 2024 Physical Activity and Sport Survey, Leger with CFLRI
Volunteers were asked the length of time that they had been volunteering; approximately a quarter of volunteers did so for more than a decade.
Volunteers were asked the length of time that they had been volunteering. Two in ten (19%) individuals said that they volunteered for less than a year, 29% reported one to three years, 16% cited four to six years, 9% indicated seven to nine years, and 26% said ten years or more.
Younger adults (less than 25 years) were more likely that those aged 45 to 64 years to report volunteering for less than a year, or one to three years. A greater percentage of adults aged 25 to 44 years reported volunteering for four to six years compared to individuals aged 45 to 64 years. Generally speaking, the percentage of adults that volunteered for at least ten years increased with increasing age.
Figure 7: Length of time volunteering by age
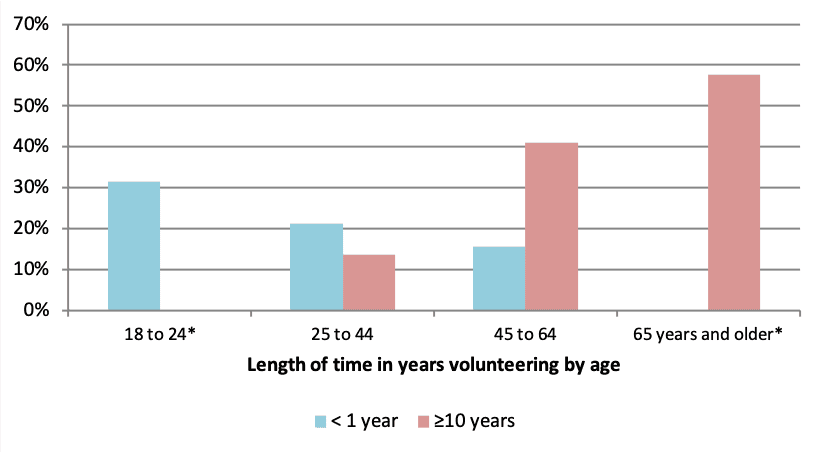
Source: 2024 Physical Activity and Sport Survey, Leger with CFLRI
*Data suppressed due to cell size
Individuals living in households with lower incomes (<$40,000 per year) were more likely than individuals living in households with higher incomes ($60,000 or higher) to have volunteered for less than a year. A higher percentage of individuals living in rural environments volunteered for at least ten years compared to those living in urban environments. A greater percentage of adults born in Canada reported volunteering for at least ten years compared to those who were born elsewhere, whereas the opposite relationship exists in that a greater percentage of those who were born elsewhere have volunteered for less than one year compared to those born in Canada.
The majority of volunteers received adequate training.
Seven in ten volunteers agreed that they received adequate training to conduct their volunteer duties effectively. Less than two in ten adults either disagreed (13%) that they received adequate training or neither agreed nor disagreed (17%). Although there were no gender-related differences, there were differences with age; individuals 45 years and older were more likely to agree that they received adequate training compared to younger adults.
Adults were also asked whether they found the amount of time spent on training acceptable or excessive. Seventy-eight percent agreed that the amount of time spent training was acceptable, whereas only 9% disagreed and 14% neither agreed nor disagreed. Almost four in ten agreed that the amount of time spent training was excessive, while 46% disagreed and 16% neither agreed nor disagreed with the statement. A higher percentage of individuals 45 years and older agreed that the amount of time spent training was acceptable than those younger than 45 years.
Production of this summary has been made possible through a financial contribution from the Government of Canada. The views expressed herein do not necessarily represent their views.