2019-2021 Physical Activity Monitor (Adult Focus),

The Canadian Fitness and Lifestyle Research Institute’s (CFLRI) 2019-2021 Physical Activity Monitor (PAM) asked adults aged 18 years and older if they participated in sport within the past 12 months. In this study sport was defined as ‘physical activities that usually involve competition, rules, and develops specific skills’. Despite the known benefits of sport participation, such as fitness, mood, self-esteem, social cohesion and academic performance1, results showed that just over one-quarter (27%) of adults participated in sport.
Sport participation differed across gender and age. Men (36%) were considerably more likely to have participated in sport within the year compared to women (19%). Sport participation among women decreased with increasing age, and the lowest rates of sport were observed among older women (i.e., from 40% among 18- to-24 year-old women to 10% among women aged 65 years and older).
Figure 1: Sport participation among adults by age and gender
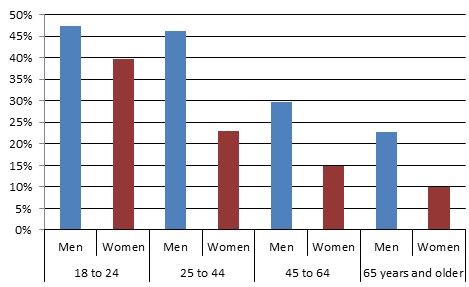
Source: CFLRI, aggregated results from the 2019-2021 Physical Activity Monitor
The survey also asked adults to report on the regularity and frequency of sport participation; regularity of participation refers to how many months out of the year individuals participated in sport, whereas frequency refers to the typical number of days they participated in sport during a week. Interestingly, there was no significant difference between men and women in how often they participated.
When looking at women specifically, four out of ten women said that they participated in sport for one to five months out of the year, 28% reported participating for 6 to 11 months, while fewer (20%) indicated that they participated all year long. Approximately one in five (19%) women reported participating in sport at least 4 times per week, 41% participated 2 to 3 times per week, 27% participated once a week, and 13% either never participated, participated less often, or their participation was variable (e.g., per week or by season).
Figure 2: Regularity and frequency of sport participation among women
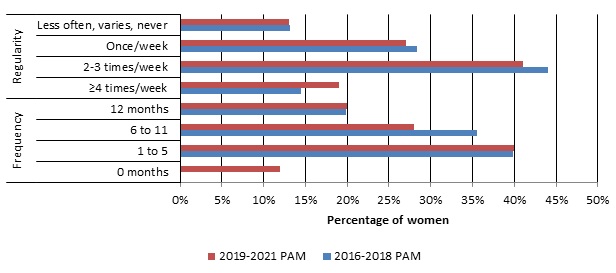
Source: CFLRI, aggregated results from the 2016-2018, 2019-2021 Physical Activity Monitor
The gender gap in sport participation has persisted for decades.
The considerable differences in sport participation rates between men and women have persisted for decades. Since 2004, the gap has ranged between 21-22%; in the most recent collection, however, this substantial difference has decreased slightly to 17% (see Figure 3). This data collection occurred partially during the COVID-19 pandemic, so it is unclear if this slight decrease is due to a change or due to extraneous factors like the pandemic had on society. Future studies will assist us in determining if we are making slight in-roads in decreasing the disparities between men and women. Generally speaking, the frequency and regularity of participation for women was somewhat consistent over time (Figure 2), with some slight differences between 2016-2018 and 2019-2021.
Figure 3. Trends in sport participation among women (2004-2021)
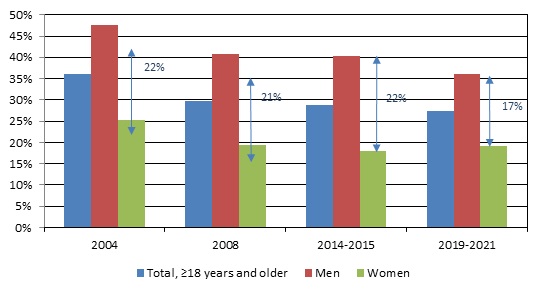
Source: Canadian Fitness and Lifestyle Research Institute, aggregated results from the 2004, 2008, 2014-2015, 2019-2021 Physical Activity Monitor
Interestingly, when examining the relationship between sport participation and household income by gender, there was a significant relationship between participation and household income for men but not for women. Figure 4 illustrates the findings of this relationship.
Figure 4. Sport participation by household income by gender
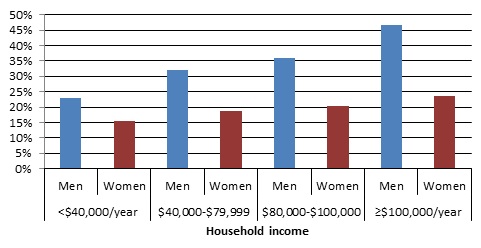
Source: CFLRI, aggregated results from the 2019-2021 Physical Activity Monitor
Most women participate in an unstructured form of physical activity and sport.
The CFLRI’s 2019-2021 Physical Activity Monitor also explored participation in organized (e.g., aerobics, walking clubs or baseball) and unorganized (e.g., walking to work or bicycling) physical activity and sport. One-quarter of women (20% of men) said that they participated in organized, whereas 69% of women (68% of men) reported participating in unorganized/unstructured physical activity or sport in the twelve months preceding the survey.
Older adults were least likely to have participated in organized and unorganized physical activities and sport. Older women (65 years and older) were less likely than women aged 18 to 24 years to have participated in organized activities. With regards to unorganized physical activity and sport, the age-related pattern, whereby older adults were least likely to participate, is true for both men and women.
When asked about the level of satisfaction with opportunities for organized and unorganized activities in the community, results showed no significant differences between women and men. Specifically, 41% of women (42% of men) indicated that they were very satisfied with the amount of organized opportunities and 50% of women (45% of men) were very satisfied with the amount of unorganized physical activity and sport opportunities in the community.
Satisfaction with opportunities for organized physical activity opportunities differed by age. Compared to adults under the age of 45, those 65 years or older were more likely to be very satisfied with the amount of organized physical activity opportunities available within the community. When looking at age-related differences by gender specifically, however, older women (65 years and older) were significantly more likely to be very satisfied with the amount of opportunities compared to younger women (aged 18 to 24 years).
1 Malm C., Jakobsson J., Isaksson A. 2019. Physical Activity and Sports-Real Health Benefits: A Review with Insight into the Public Health of Sweden. Accessed from: https://www.mdpi.com/2075-4663/7/5/127/htm